Other Research
Studying the Membership and Binary Populations of Open Clusters
 As part of the WIYN Open Cluster Study (WOCS), I helped continue a decades-long radial-velocity (RV) survey of open clusters. With the WIYN/Hydra multi-object spectrograph, we obtained multi-epoch, high-precision (0.4 km/s) RV measurements that were used to determine cluster membership and to characterize the population of spectroscopic binaries.
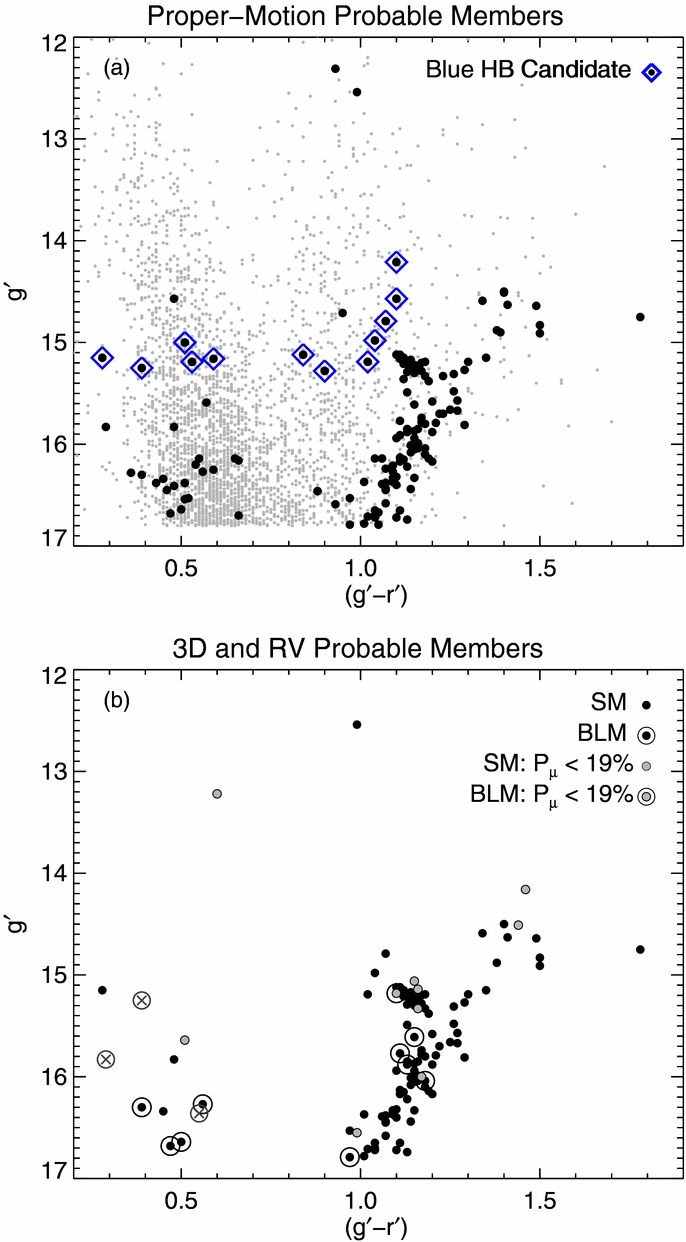
The old, metal-rich open cluster NGC 6791 has fell under my stewardship during my time in the WOCS collaboration and in 2014 we published a paper presenting our membership results and a list of velocity-variable, binary-likely members. The main figure from this work is presented at the right. The top panel is a color-magnitude diagram (CMD) of every star within a square degree of the cluster center. Field stars are presented in grey and likely cluster members from a proper-motion survey are presented in black. Points with blue diamonds around them are proposed “blue horizontal branch” stars. These were of interest because Helium-burning stars in metal-rich clusters, like NGC 6791, are expected to fall in the Red Clump. If members, these stars would require their envelopes to have been stripped to reside in this portion of the CMD.
In the bottom panel, we include our RV membership information showing that many of the proposed blue horizontal branch stars are no longer members. Instead, we find a rich population of blue stragglers opposite the red giant branch. Consistent with previous studies of blue stragglers, we find many of them to be spectroscopic binaries, suggesting a binary mass transfer origin.
A link to the peer-reviewed paper can be found here.
A follow-up paper is currently in preparation to present membership statuses for an expanded (dimmer) sample and full orbital solutions for binary members.
(This work would not have been possible without the following people: Robert Mathieu, Natalie Gosnell, Emily Leiner, Katelyn Milliman, and Imants Platais)
X-ray Spectroscopy of Recurrent Novae
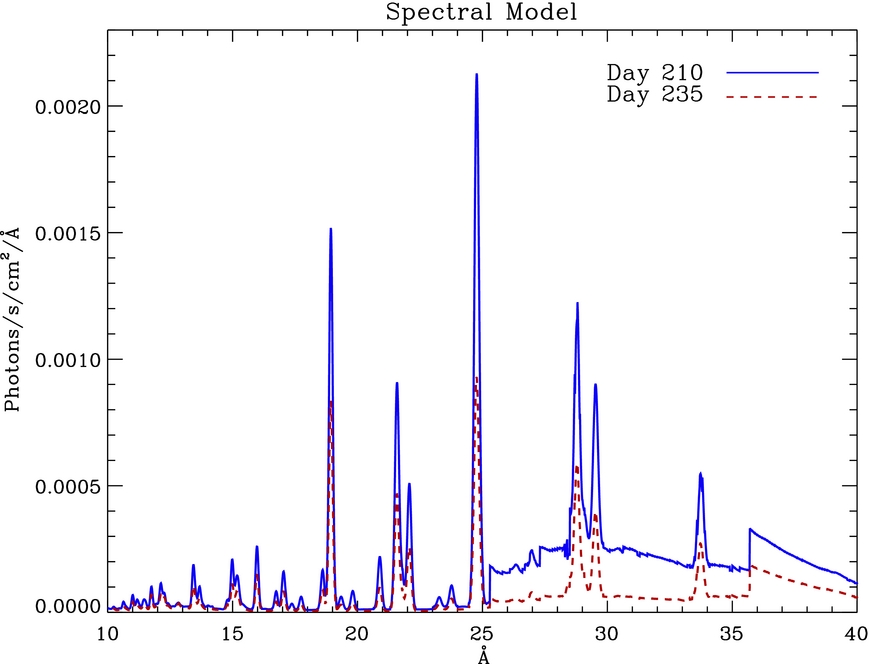 For my Masters Thesis, I worked with Dr. Marina Orio studying the X-ray spectra of recurrent novae during outburst. X-ray grating spectra from Chandra and XMM-Newton are capable of probing the hottest clumps of ejected material and, once they become optically thin, the hot white dwarf (WD) atmosphere itself. With two observations during the decay of the 2011 outburst of T Pyxidis, we measured the declining temperature and luminosity of the white dwarf atmosphere. The figure to the left presents the modeled ejecta emission lines on top of the WD continuum from our two observations. We also used the He-like triplets of O VIII and N VI as nebular diagnostics to measure the temperature and density of the ejected material. The high densities found suggested a clumpy ejecta, as opposed to a constant-density shell, which would correspond to an unrealistically large mass ejection. We also found the X-ray continuum flux to vary periodically on the orbital period, suggesting temperature inhomogeneities on the WD surface.
A link to the peer-reviewed paper can be found here.
Optical and Near-Infrared Time-Series Photometry of Stellar Flares
 As an undergrad at the University of Washington, I worked with Prof. John Wisniewski on a project at the intersection of stellar variability and exoplanet detection. The detection and characterization of exoplanets has many advantages in the infrared (IR): the star-planet brightness contrast is reduced, planet emission peaks in the IR, and the emission from M dwarfs (whose habitable-zone Earth-mass planets are most readily detectable with current capabilities) peaks in the IR. One caveat is that low-mass stars host a variety of stellar activity that can complicated the detection and characterization of exoplanets. Furthermore, the signatures of these phenomena, known extensively in the optical, are not well characterized in the IR.
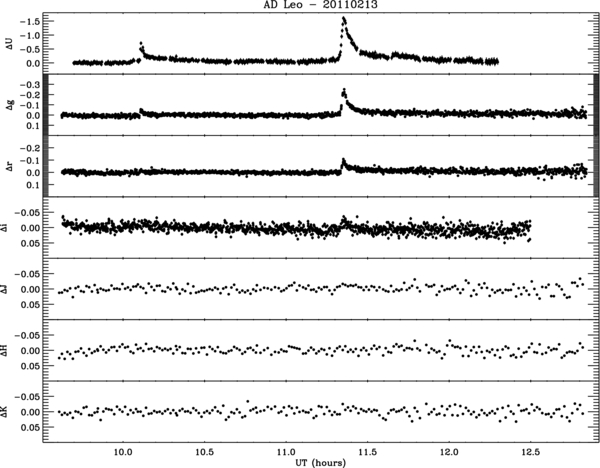
To better understand the sources in stellar variability in the IR, our project searched for continuum variations in the near-IR associated with stellar flares. By monitoring a sample of known M dwarf flare stars simultaneously in the near-IR and optical (where flares are easily detectable), we were able to compare the broadband response across wavelength regimes. The figure to the right presents one night of observation in which we detected a flare in the optical. With no detectable increase in the IR, we placed upper limits on the IR response based on the optical energy output.
A link to the peer-reviewed paper can be found here.
While this null result is encouraging for future exoplanet characterization in the IR, the picture has become less clear since our 2012 paper. More broadband continuum flares have been reported in the near and mid-IR, most notably in the Spitzer light curve of the multi-planet hosting M dwarf, TRAPPIST-1. Based on our upper limits above, these would correspond to enormous events in the optical, unlike those typically observed. This suggests the existence of IR emission mechanisms that are not included on the current models stellar flares.
(This work would not have been possible without the following people: John Wisniewski, Adam Kowalski, Suzanne Hawley, James Davenport, and Sarah Schimdt)
Analysis of the Column Density Distribution of Simulated MHD Turbulence
 Before starting graduate school at the University of Wisconsin, I spent a summer in Madison doing research as part of the NSF REU program. I worked with Prof. Alex Lazarian and, then graduate student, Blakesley Burkhart on a project analyzing the column density distribution of simulated magnetohydrodynamic (MHD) turbulence.
The primary motivation of our work was to find a novel way of analyzing observable quantities of the interstellar medium (ISM), namely the projected column density, that could reveal the level of turbulence and the magnetic field strength. Turbulence and magnetic fields play a large role in the evolution of the ISM and the formation of stars, but they are notoriously hard to measure.
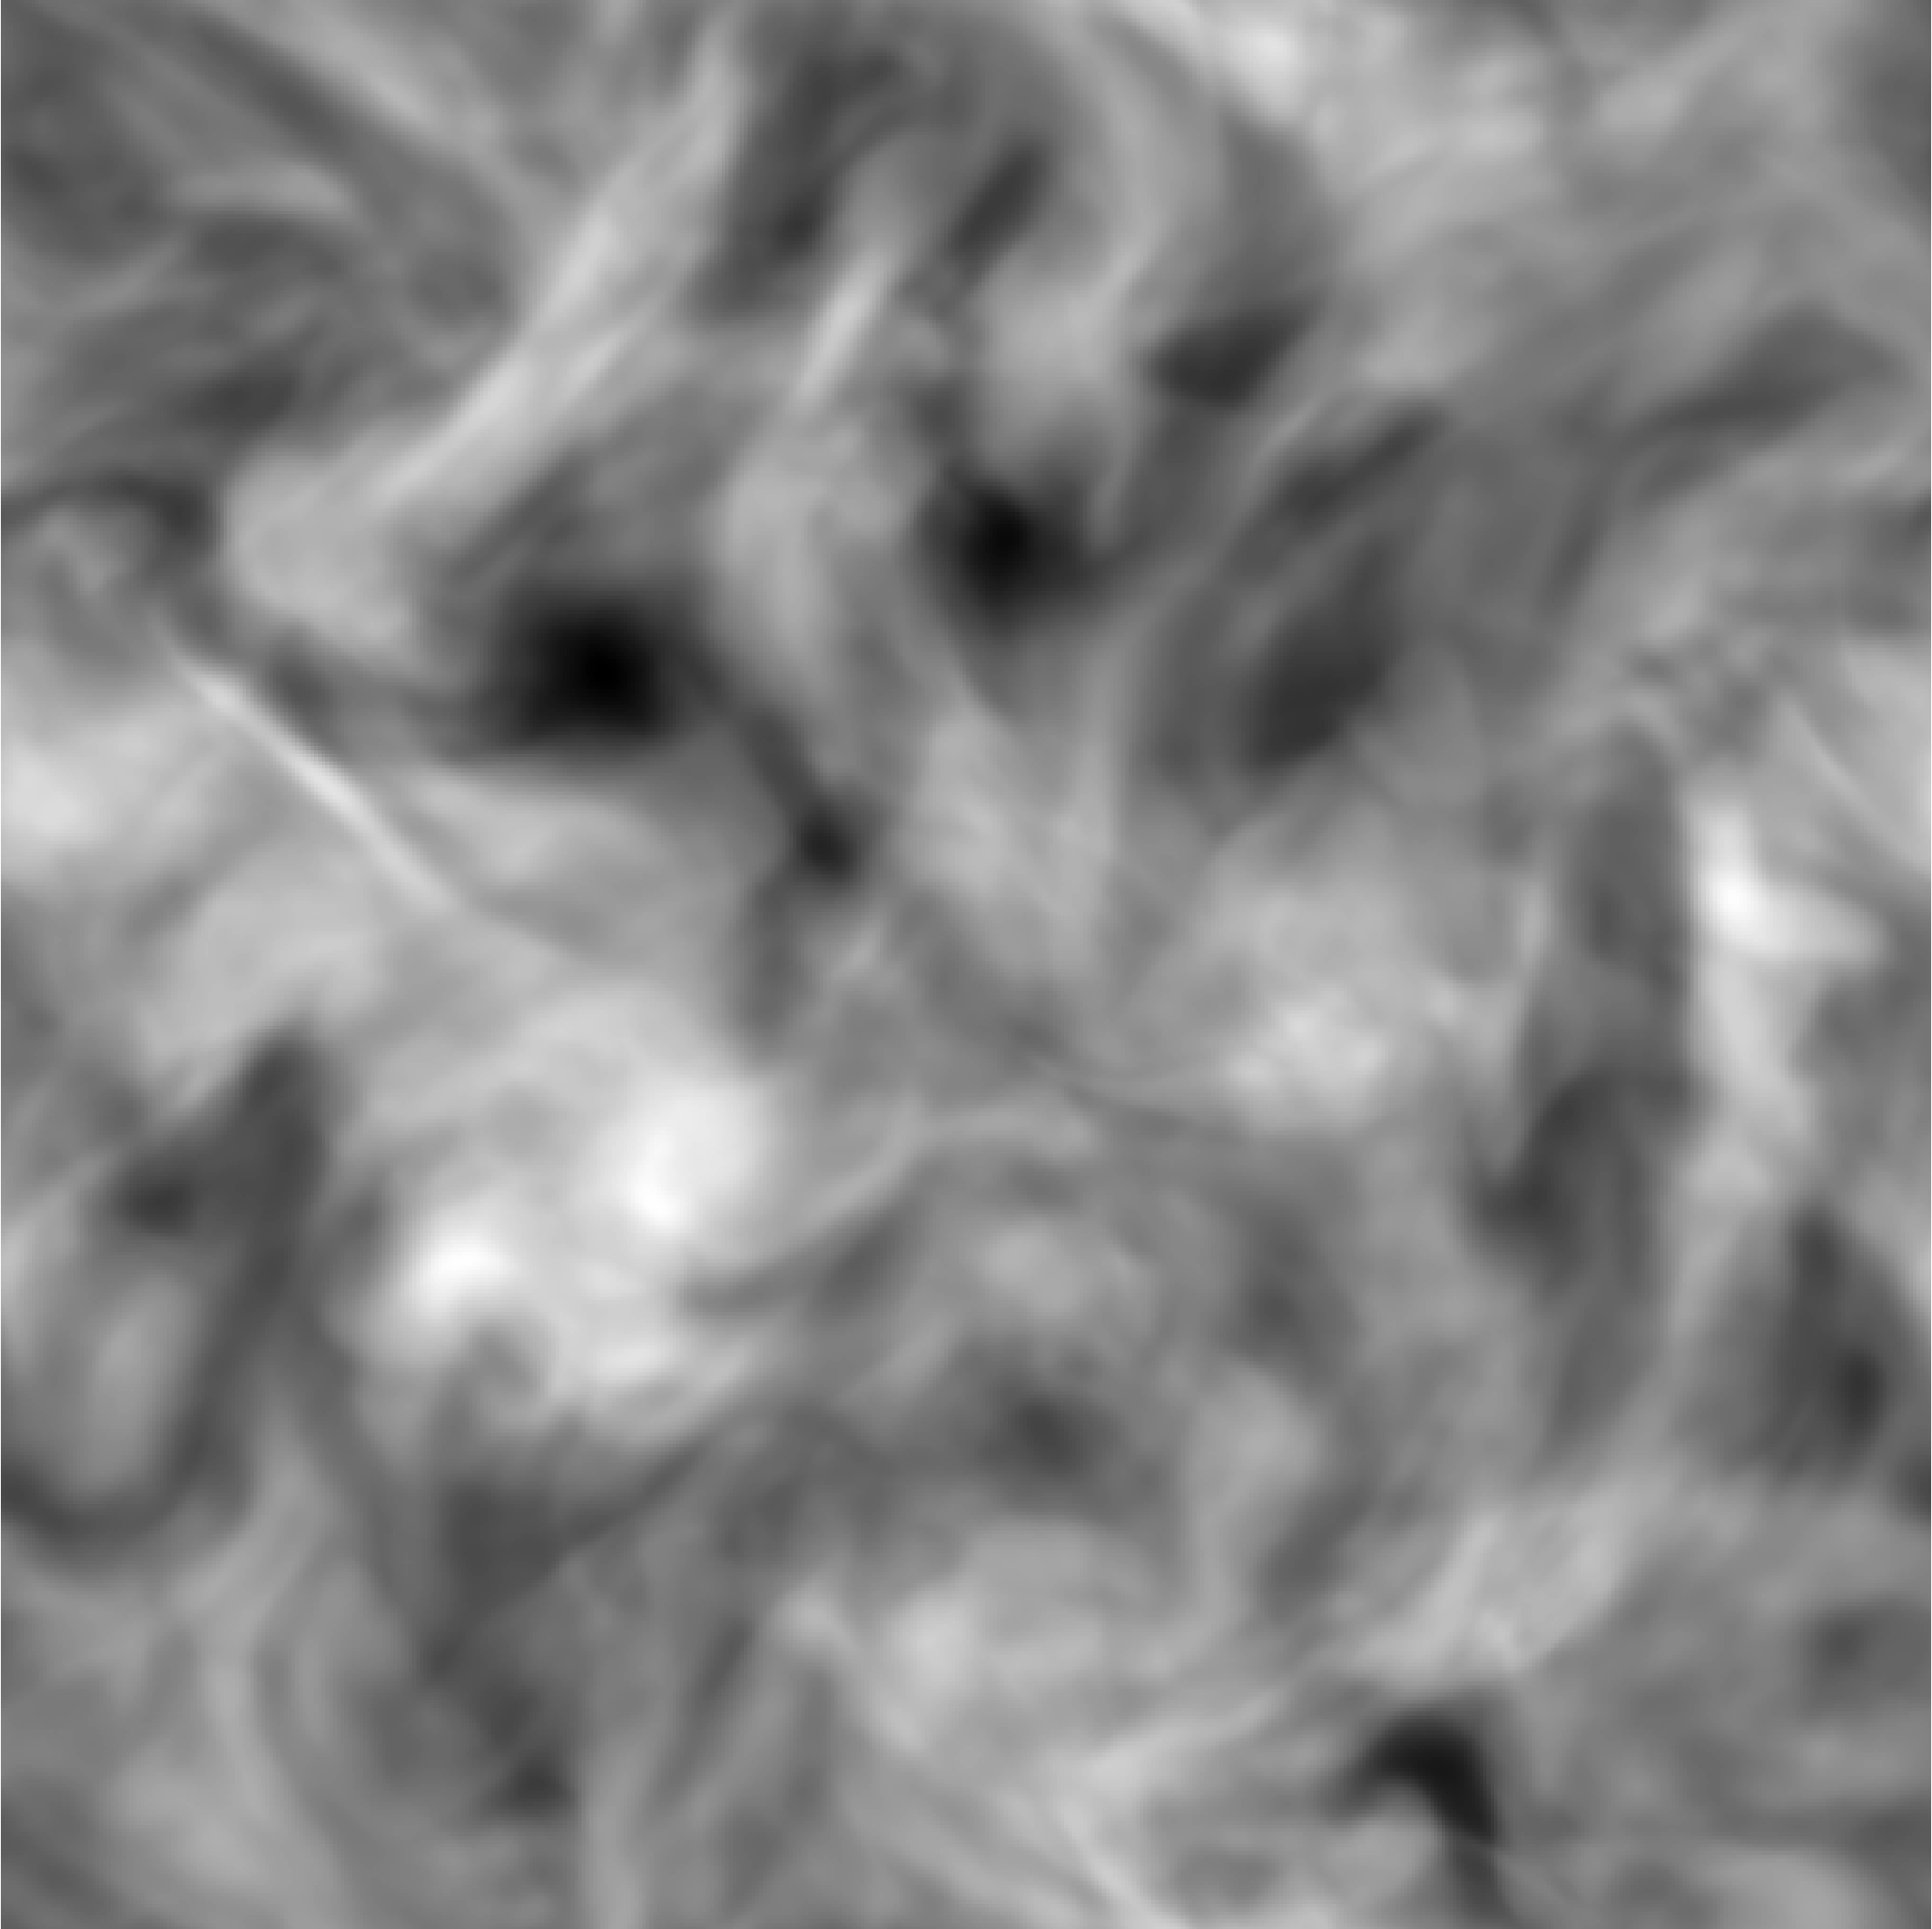
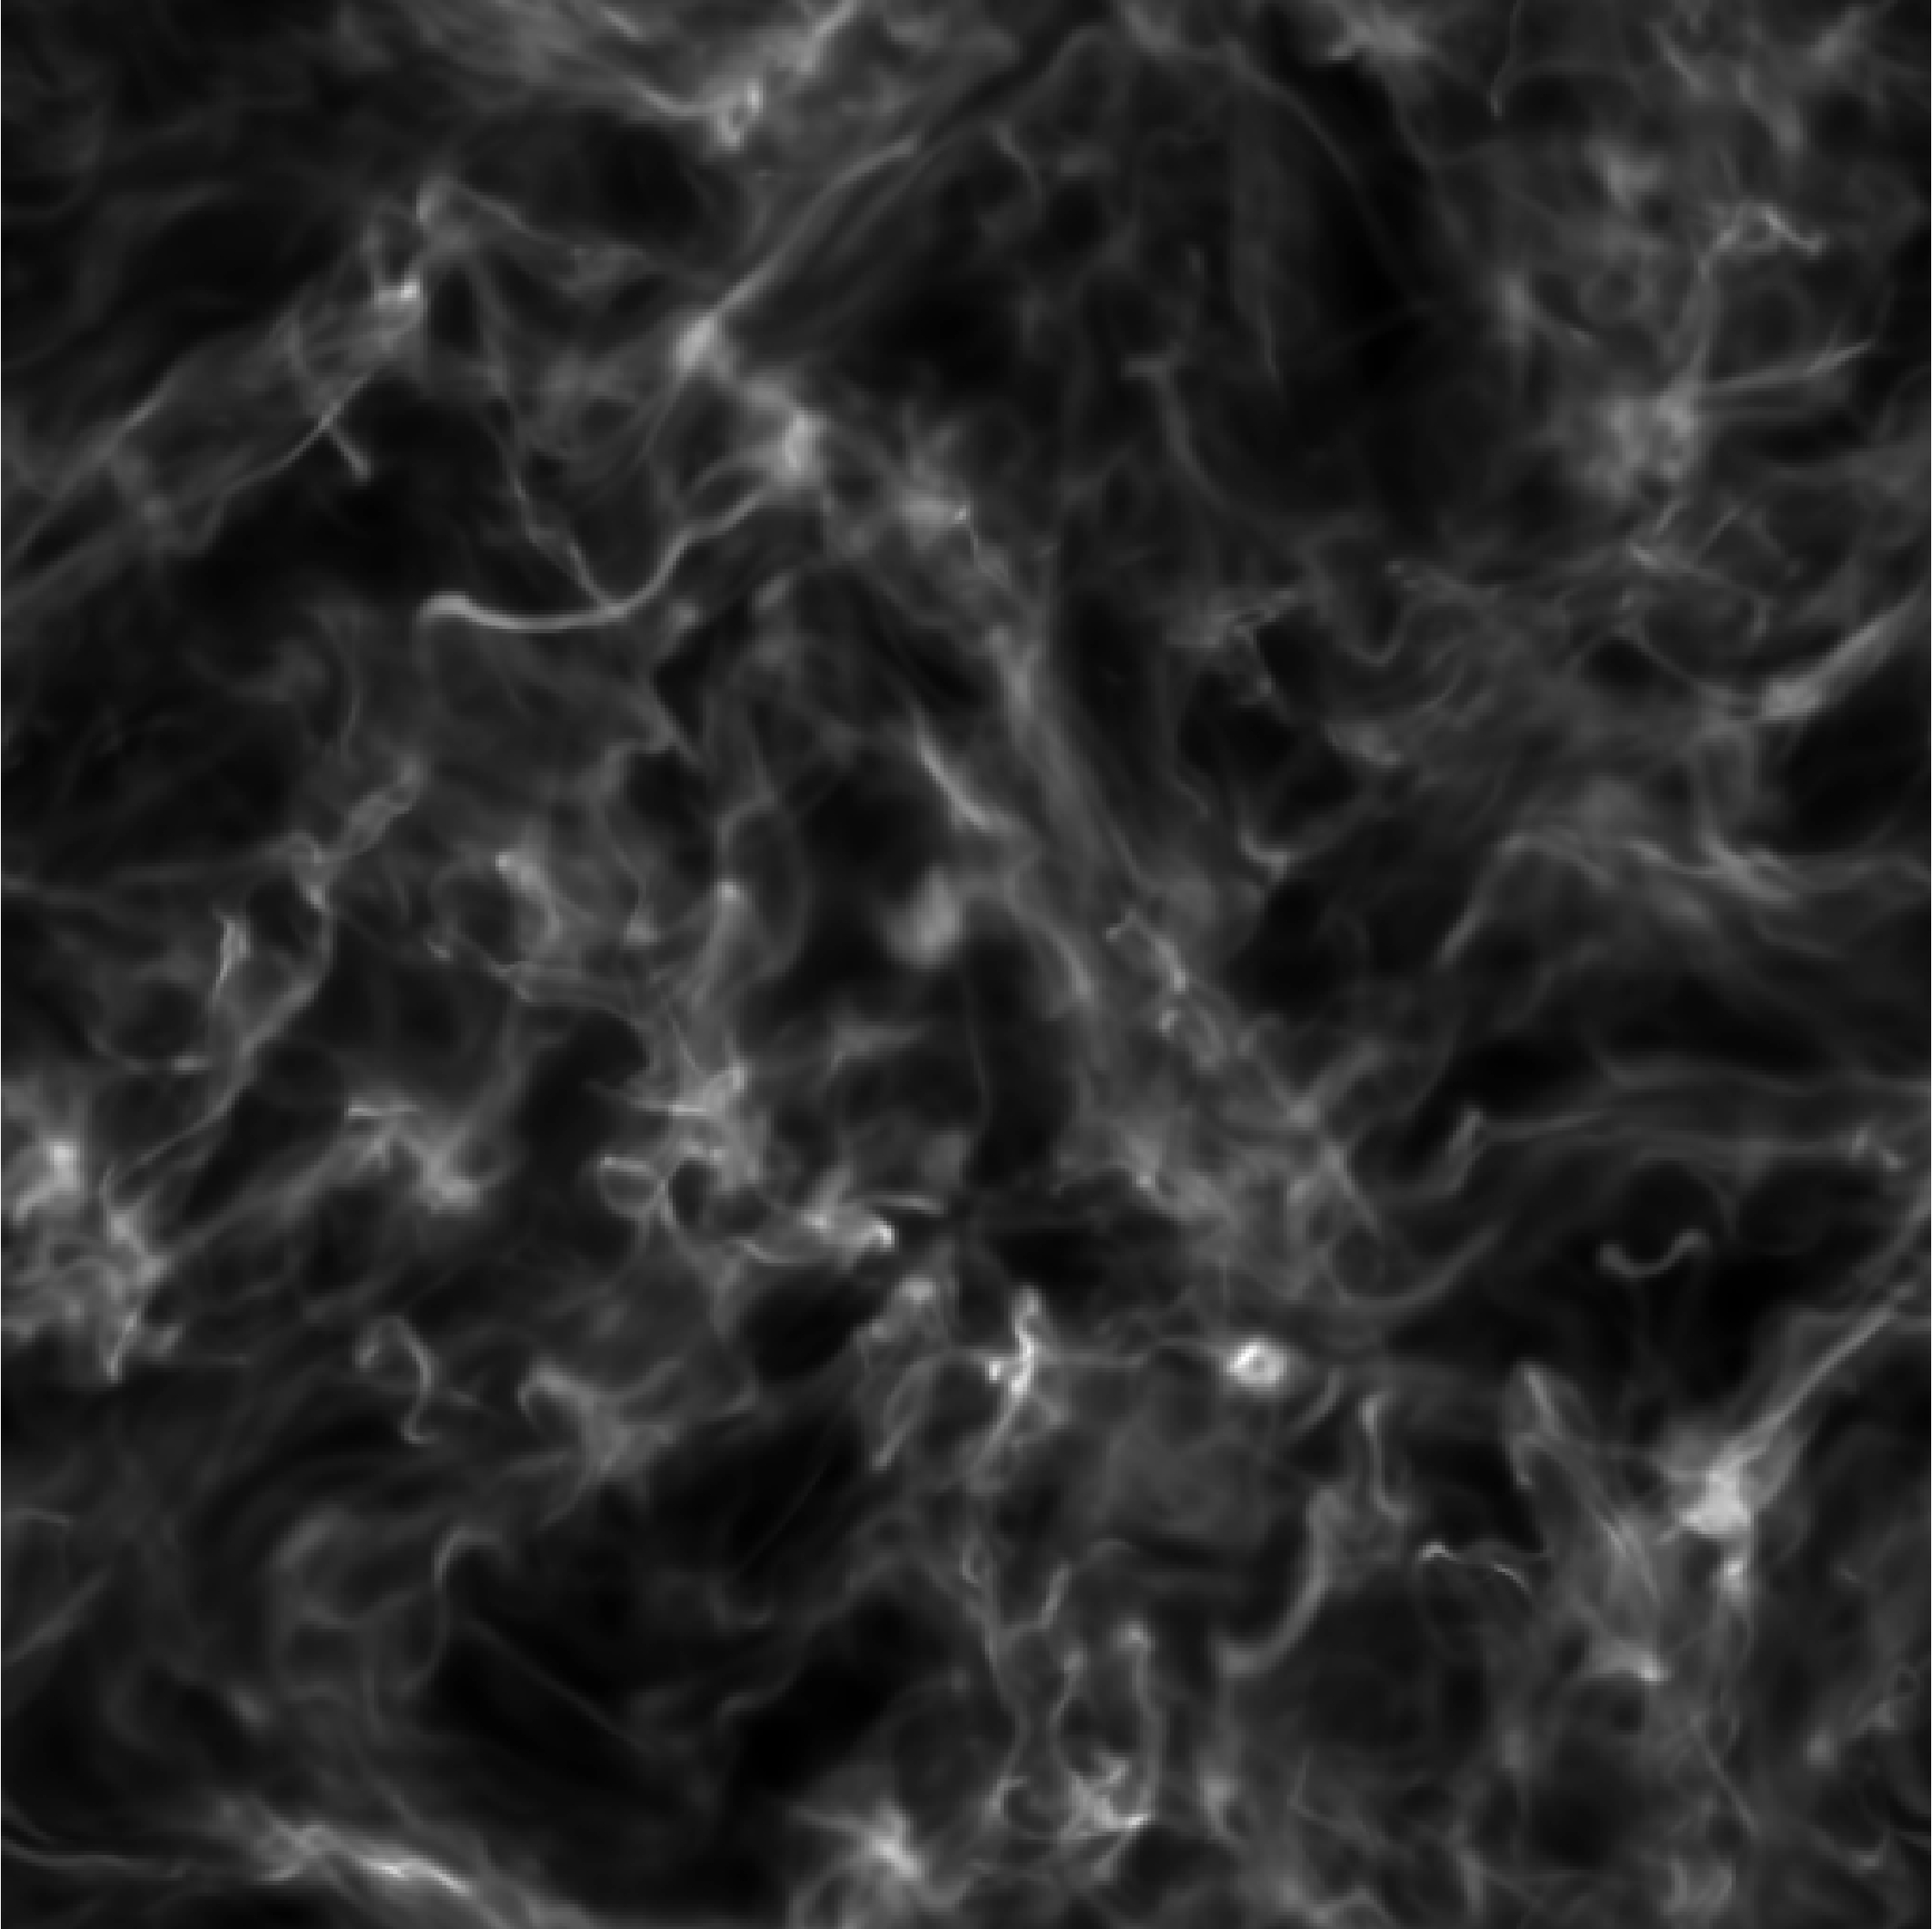
With 14 magnetohydrodynamic simulations of varying turbulent and Alfenic mach number, we compared their two-dimensional column density distributions, as described by the Tsallis function, to look for correlations between the Tsallis fit parameters and physical parameters of simulations. In essence, the Tsallis function describes the difference in column density across varying spatial scales. As an illustrative example, the figures above display two simulations, one with subsonic turbulence (left) and one with supersonic turbulence (right). They clearly have very different density distributions – the left shows little variation across spatial scales, producing a flat distribution, while the right varies significantly across the simulation, producing a sharply peaked distribution.
One exciting result of our work was that, for all other parameters being equal, and increased magnetic field strength produced more narrow spatial density distributions. As only the second statistical tool describing column density that is sensitive to the magnetic field (after the bispectrum), it is a promising tool for the analysis of real ISM observations.