Time-Series Spectroscopy of Accreting Pre-MS Binary Stars
(A more general overview of my thesis can be found here.)
Motivation
Our effort to observationally characterize the binary-disk interaction with time-series, optical and near-infrared photometry (more about that here) has allowed us to make critical tests of binary accretion theory. This method, however, only provides coarse information, such as the combined accretion rate onto both stars and the relative temperature and amount of circumstellar dust near the stars. Most importantly, these data do not supply kinematic information on the accretion streams that bridge the gap between the central binary and the circumbinary disk.
The prediction of periodic pulsed accretion events, which our photometry supports, has become a consensus of numerical simulations from many different groups. One prediction that sets different simulations apart, however, is the star that preferentially accretes mass from the circumbinary streams. Some modeling efforts suggest that mass will preferentially feed the primary or secondary depending on the orbital parameters. Others suggest the disk itself plays a significant role in determining the primary accretor. The figure below from Munoz & Lai 2016 presents the accretion rate for an equal-mass binary with an eccentricity of 0.5. Each star’s accretion rate is presented separately in the red and blue curves. The star represented with the blue curve is the dominant accretor in the system, however, these authors argue this has more to do with the properties of the disk than the binary.
In these simulations the circumbinary disk develops an asymmetry that processes over the course of hundreds of binary orbits. The star whose apastron passage brings it nearest to the over-dense region of the circumbinary disk will preferentially receive more mass. During the time frame plotted above, that star is depicted in blue, but as the over-density processes, the star depicted in the red curve will become the dominant accretor (see Figure 3 in Munoz & Lai 2016).
The discussion above is just one possible explanation of the physics involved in determining which star is the dominant accretor in a binary system. But it exemplifies the types of detailed inferences that can be made about the binary-disk interaction and inner disk dynamics generally with information on the kinematics of accretion flows.
Time-Series Spectroscopy
For a subset of the binaries in our photometric sample we have obtained time-series, high-resolution, optical spectroscopy. These observations allow us to begin to probe the kinematic properties of binary-disk interaction. It was crucial that these observations overlap with our more densely sampled photometric coverage to provide context with the large-scale accretion trends in the systems.
Our spectra come from the SALT telescope’s High-Resolution Spectrograph (HRS) and the SMARTS 1.5m CHIRON spectrograph. Both are echelle spectrographs providing spectral resolutions of R~30,000 and wavelength coverage from ~3300-9000Å.
Results - TWA 3A
TWA 3A is a near equal mass (q=0.84), pre-MS binary with an eccentricity of 0.63 and an orbital period of 34.9 days. Over the course of 3 consecutive orbital periods we were able to obtain 14 SALT/HRS spectra.
H-alpha
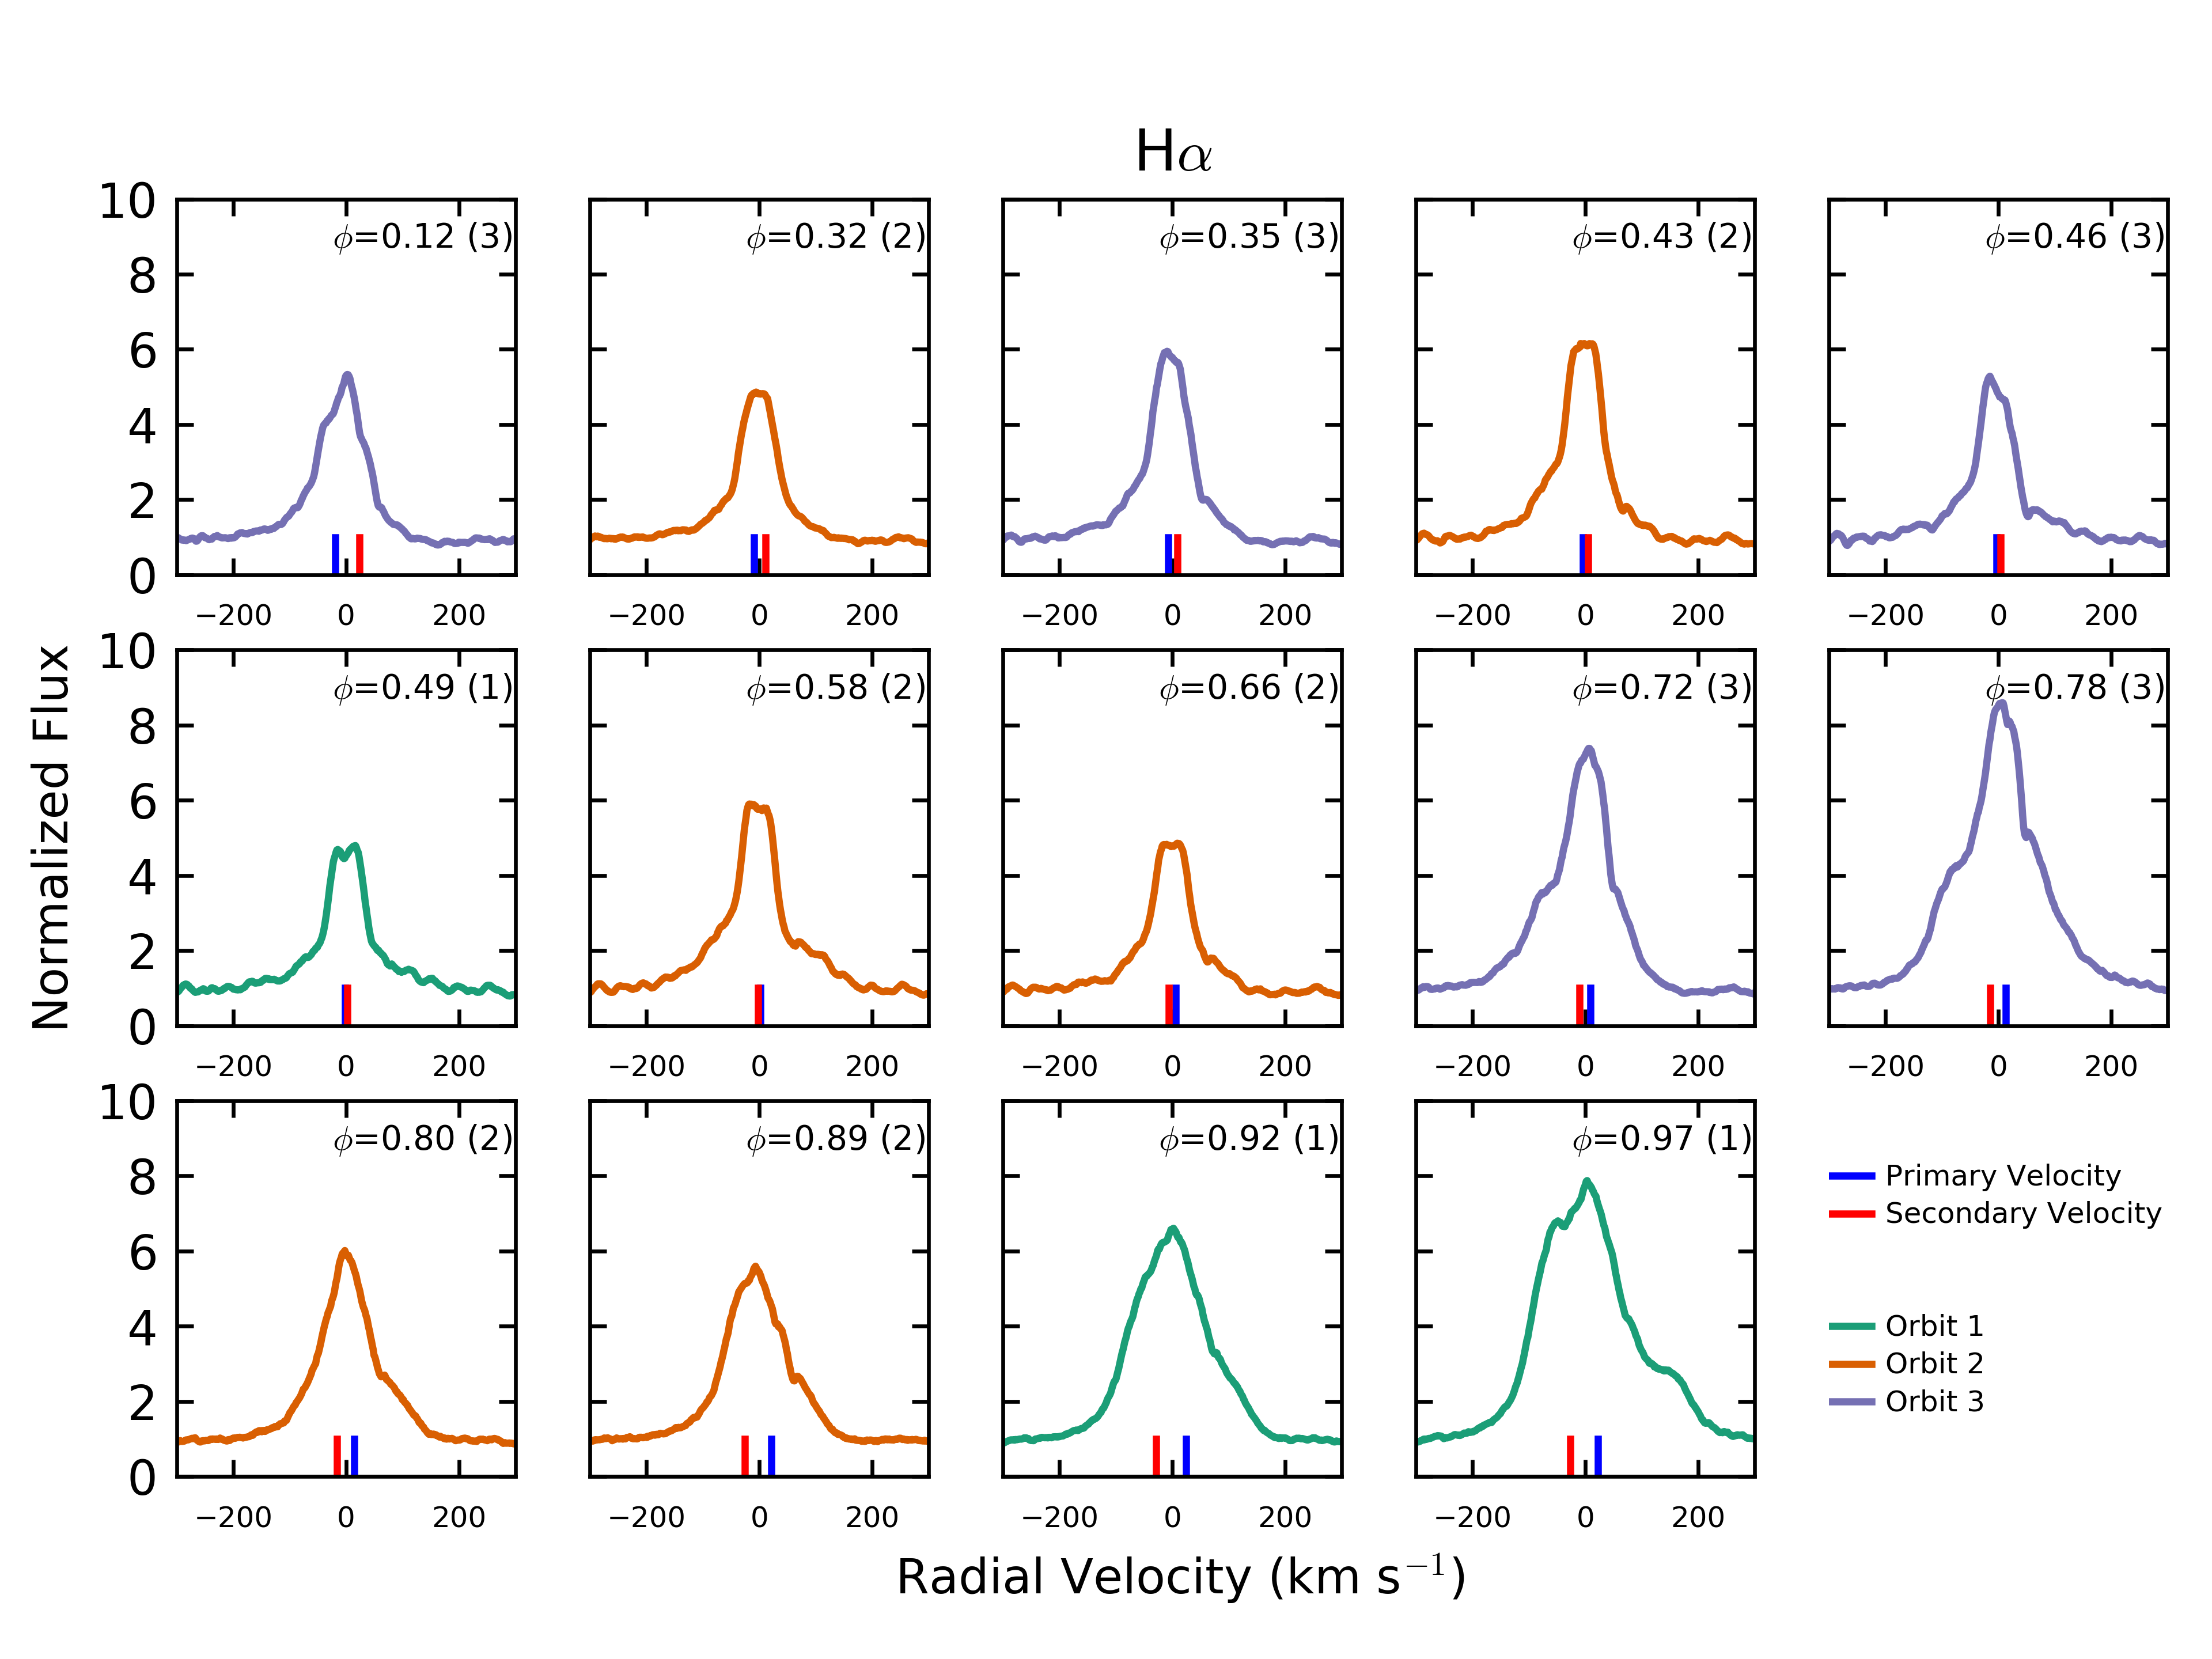
The figure below presents the accretion tracing emission line H-alpha. Observations are ordered according to their orbital phase listed in the top right of each panel; the color-coding and number in parenthesis designates the orbit in which the observation was made. Following the conclusion made from U-band observations (also tracing the accretion rate), the H-alpha emission increases near periastron passage, just as models would predict for an eccentric binary. The vertical blue and red lines at the bottom of each plot mark the primary and secondary stellar velocity, respectively. Due to H-alpha’s large and complex emission profile, it is difficult to ascribe the emission to one star over another. Structure in its high-velocity wings, however, may be able to trace accretion streams further from the stars.
The Broadening Function via saphies
One challenge in the analysis of TWA 3 is that it is a triple. Not only is there light from three stars to decompose, the level of the triple’s contribution is variable. Depending on the ‘‘seeing’’ of the observation, there may be more or less triple flux sneaking into the HRS fiber.
 To address this, I developed a python implementation of a spectral-line broadening function (BF) analysis (e.g., Rucinski 1992). The code lives in the saphires (Stellar Analysis in Python for HIgh REsolution Spectroscopy) package (pip installable). The code uses a narrow-lined template to decompose an observed spectrum and reconstruct its average photospheric absorption-line profile. If the observed spectrum contains one star, the BF will return one profile. If the observed spectrum contains three stars, the BF will return three profiles, as shown in the figure to the right. The location of the profile measures the stellar RV(s), width of each profile can be modeled to measure the v sin i, and the area under each profile encodes the component flux ratios.
With this technique, I was able to decompose the sources of stellar light and then subtract them from the observed spectra, leaving behind emission that is exclusively due to accretion.
He I 5876
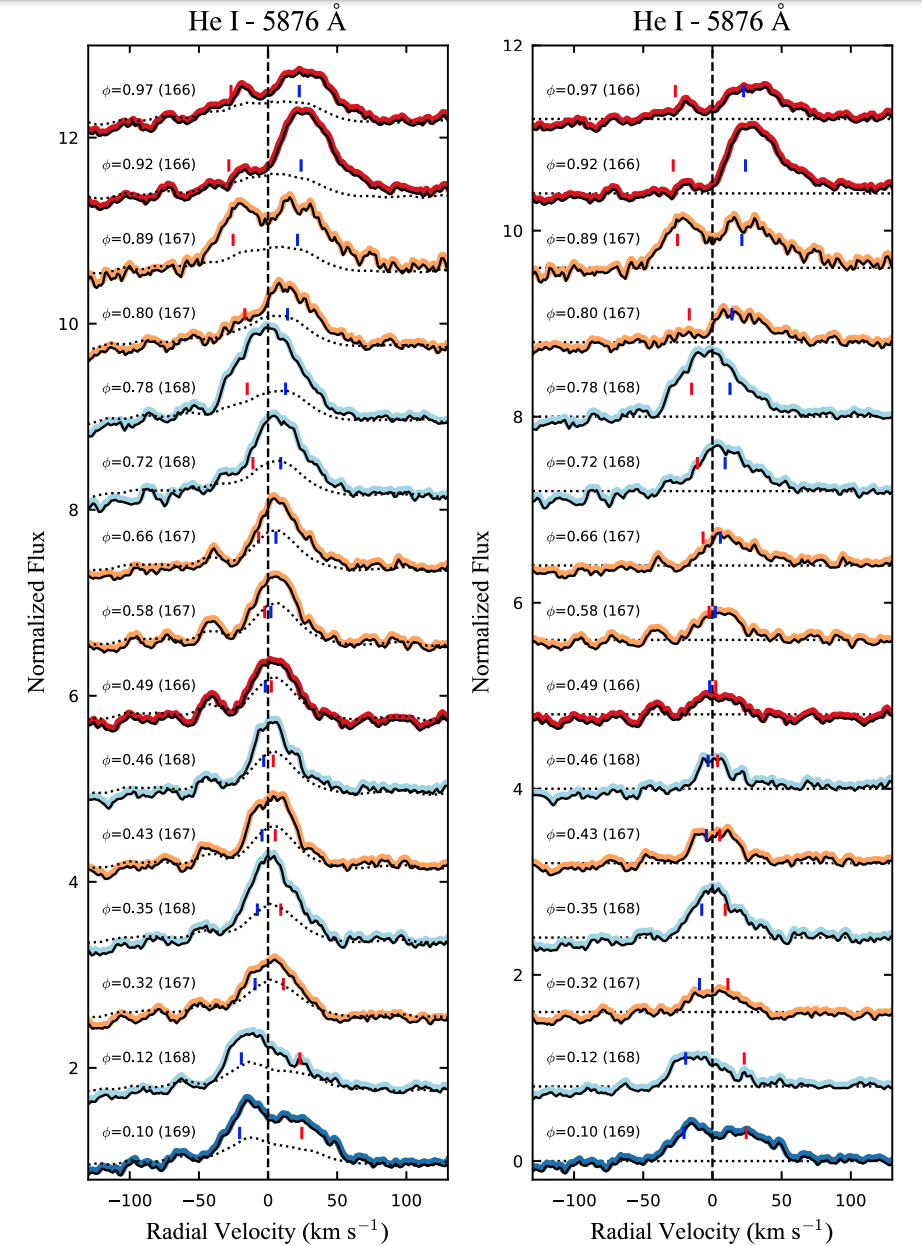
The figure below presents the accretion tracing emission line He I 5876Å. As with the plot above, the spectra are ordered by their orbital phase and color-coded by the orbit in which they were obtained. Both are presented as text to the left of each line. Blue and red vertical lines associated with each spectrum mark the primary and secondary stellar velocities, respectively. The left panel presents the observed spectra and the right presents the line profiles after the stellar components have been removed.
Due to its relatively narrow width, we can use He I to trace which star is the dominant source of accretion emission. The He I velocity centroid regularly coincides with the primary velocity, suggesting it is the primary accretor. This result is in tension with models that predict that the secondary star should always be the dominant accretor, and may support models with a processing inner disk.
A link to our peer-reviewed paper on TWA 3A can be found here.


